Hello Everyone,
I would like to share with you a few changes we’ve been making to the Science lab. The transition to the new building has gone well, but we still have work to do to bring the lab up to higher standards. Two signs of progress are a new Smart Board, installed a few weeks ago, and an order for a UV/VIS Spectrometer. The Smart Board has been noted on Edline and this blog and I hope to add additional information by the end of the school year. Ask to see it if you are visiting.
This UV/VIS Spectrometer is a workhorse analytical instrument in every science lab. It is used for both identification of a substance and the measurement of its concentration. UV/VIS stands for Ultraviolet/Visible which signifies the wavelengths of light used for the analysis. The technique is based on the principle that most chemical substances have bonds that will absorb specific wavelengths of light. The Wikipedia explanation is actually quite good:
“Ultraviolet–visible spectroscopy or ultraviolet-visible spectrophotometry (UV-Vis or UV/Vis) refers to absorption spectroscopy or reflectance spectroscopy in the ultraviolet-visible spectral region. This means it uses light in the visible and adjacent (near-UV and near-infrared (NIR)) ranges. The absorption or reflectance in the visible range directly affects the perceived color of the chemicals involved. In this region of the electromagnetic spectrum, molecules undergo electronic transitions. This technique is complementary to fluorescence spectroscopy, in that fluorescence deals with transitions from the excited state to the ground state, while absorption measures transitions from the ground state to the excited state.[1]”
I am easily diverted by discussion of the electromagnetic spectrum (ES), so I’ll simply add the following descriptive figure. The ES is simply the continuum of electromagnetic energy that ranges from high energy gamma waves to low energy radio waves. “Visible light” simply means that portion that humans can see with their eyes. (http://www.colourtherapyhealing.com/colour/electromagnetic_spectrum.php):


IR Spectrum of Caffeine

Similar Molecules Produce Different Spectral Patterns
http://www.sgk.mpg.de/private/barbatti/pics/ua_spect.jpg
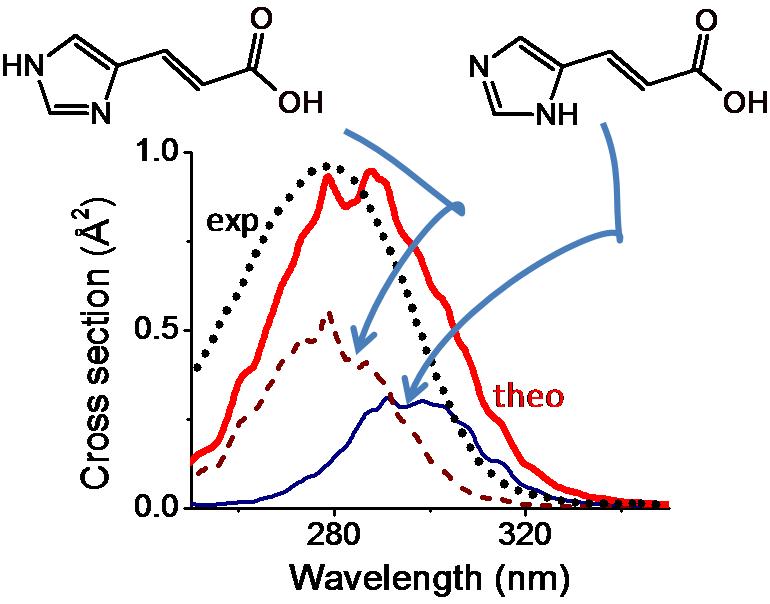
Each peak results from a different bond structure. These spectra can be analyzed peak-by-peak to determine a molecule’s identity since the wavelength of light absorbed correlates with the type of bond . Most commonly, however, it is matched to an existing database of spectra for known compounds. The height of the peaks is indicative of concentration.
We will use this instrument in Chemistry, Biology, Forensics, and Earth Science. Thanks to the PTO for giving the students this opportunity.
this is awesome! so glad you were able to get this to enhance the science experience of the high school students.
ReplyDelete